|
Ordnance Survey
Maps - The best maps for walking in the UK
See the full range of
1:25000 Ordnance
Survey maps .
It is fairly
safe to say that "OS" maps are the best in the world giving a
wealth of information in a variety of scales. The most familiar are the
1:50,000 Landranger and 1:25,000 Explorer ranges. They are available from
most walking shops, many tourist shops and direct from Ordnance Survey. Amazon also sell them
often at
reduced cost and have a very efficient delivery.
A direct link to buy the map specific
to each walk, described under My Walks, is given on the
appropriate walk page. For walking, the 1:25000 series are strongly
recommended as they show far more detail to help you navigate, not least
field boundaries which are very useful for monitoring your progress across
the countryside or working out exactly where you are.
The
best way to look after maps when walking is to use a proper map case. This
needs to be waterproof and after trying various kinds over the years, I
recently (2021) purchased the Aquapac Kaituna Waterproof Map Holder.
It is slightly larger than my previous ones, which makes it easier to get
the maps into it. It is genuinely waterproof and I think my OS maps are worth looking
after.
Alternatively,
you could scan/print out a map on waterproof paper.
 
|
This paper scores very
highly in Amazon's Customer Reviews
Waterproof and suitable for
outdoor use, Tough and resists tears
Durable and wipe clean. High defenition and vibrant colours
Click the image for more
information
|
About Ordnance Survey Maps
The history of
the Ordnance Survey began in 1791 when the Government directed its Board of Ordnance,
the early equivalent of the Ministry of Defence, to survey
the south coast of England so that it could be adequately defended from
invasion.
So
"Ordnance Survey" (OS) was born and went on to comprehensively map
the entire country.
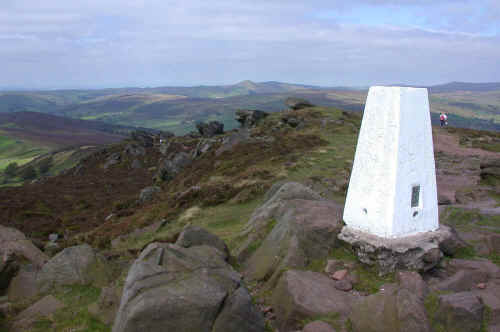
Thousands of
triangulation stations were set up at high points around the country from
which measurements were taken. These are the familiar Triangulation Pillars
or "trig
points" which walkers see on their travels. An example is shown below.
Use of these has
been superceded by the use of satellite and laser technology but the trig
points themselves are a very useful navigational aid for walkers as they
confirm your position on the ground.
They are designated on the 1:25,000
scale maps by the symbol below:

If you want to know more about
the history of the Ordnance Survey and indeed about the history of maps in
general, I enthusiastically recommend the book On The Map by Simon Garfield.
This covers the history of maps from early sketches several hundred years BC,
to Google Earth. I genuinely could not put it down.
Some
straightforward walks can be done using the 1:50,000 maps but the larger
scale 1:25,000 are much more detailed with a greater number of paths and
geographical features. This is the scale you should use and the one on which
we will concentrate.
On the 1:25,000
maps, 4 centimetres = 1 kilometre. (2.5 inches = 1 mile). For a quick visual
reference, the smaller 1 kilometre grid squares are a mile corner to corner.
To explain the
logic of the maps (and please bear with this), Great Britain is covered by 4
large 500 kilometer x 500 kilometer squares each assigned a letter H, N, S
and T.
These are each
then sub-divided into twenty five, 100 kilometer squares each of
which has another letter from A to Z (excluding I). So, if you take the
Explorer Map for The North Eastern English Lake District, its top left hand corner contains
the letters NY, the N representing the relevant 500 km square and the Y the
relevant 100 KM square.
These are
further broken down into 10 km x 10 km squares which are allocated a number
0 to 9 working from the South West corner of each 10km square, north and
east.
A further
sub-division breaks each 10 km square into 1 km squares and these form the
blue grid you see on an OS map and identified by the blue numbers across the
top/bottom and left/right hand sides. The numbers are also shown at
intervals across the maps for ease of reference in use.
Of course even a
1 km division is not sufficient for accurate navigation so this square is
divided yet again by an imaginary grid working in 10ths. A full OS reference
number for the summit of Helvellyn in the English Lake District would be:
NY 34170 15160. To break this
down and explain:
NY
34170
15160
-
N = the 500
km square
-
Y = the 100
km square
-
3 = the
number of the 10 km square
-
4 = the
start of the 4th 1 km square of that 10 km square working east
-
1 = the
number of 10ths across that 1 km square working east
-
70 = 0.70 of
that 10th
The 15160 works
on exactly the same basis but working northwards.
A simpler way of
thinking about it is that in effect the 100 km square is broken into 100ths
and the numbers from 00 to 99 are the numbers you see in blue marking the
blue grid lines on the 1:25,000 maps. Each square is 1 km x 1 km.
The
"34170" is called the "easting" and the
"15160" the "northing". OS references always give the two letters, the "easting" first, then the "northing"
In practical
terms, because it is quite difficult to accurately assess manually on a map
to six figures in each direction, OS references usually stop after 3 figures on each bearing
thus the reference above would be NY 342 152 or NY342152 (rounded up).
To demonstrate
this graphically, see the image on the right. The trig point is always displayed as a
triangle on OS maps so if we imagine the image to be the NY section
of the country, the trig point is at position NY 34170 15160. The dotted lines
represent the imaginary 1/10 divisions of the 1 km square. The bracketed
entries are the high precision elements we would not usually quote.
OS maps give the
two letter coding at the corners and again if it changes part way across a
map, if the map overlaps two grid letter areas.
The OS Grid
References are actually of little practical value in actually finding your way (except
in relation to using GPS machines). They can be invaluable in an emergency
however in directing rescuers to a specific point, assuming you know exactly
where you are.
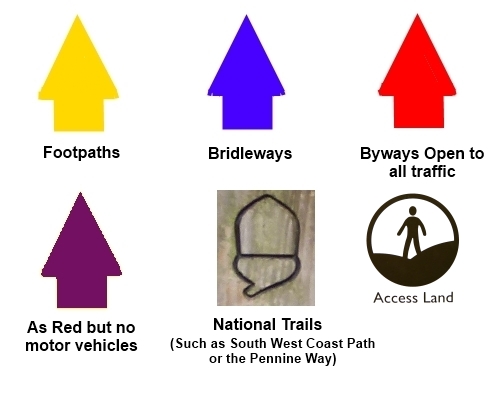
All OS maps have
a detailed key which explains all the symbols. The ones of most significance
to walkers are of course the footpaths shown below..
There are a
number of other paths/tracks marked on maps which may or may not be accessible
to the public. Those on open country usually are but some could
be private drives. This is one area where taking walks from books means
someone has done the groundwork for you.
In the field, route indicators
often bear signs which relate to the symbols on the OS maps as follows:
A
full list of OS map symbols can be viewed on the Ordnance
Survey website. Other
important indicators on the map are the brown contour lines which follow the
elevation and are at 10 metre vertical intervals and the patchwork of thin
black lines which indicate field boundary walls. Walls and rivers/streams
can all help you to relate the map to the terrain around you. The
contour lines enable you to judge the severity of the terrain and can help
judge the timing of walks (See the section on Safety). The closer together
the lines are, the steeper the gradient. The
field lines, by indicating the shape of fields will help you to work out
your position as will indications of other features (e.g. farms, churches,
barn, streams etc etc). One
of the difficulties walkers have with map reading, especially if trying to
follow a walk from a book, is that the map only sees daylight once they
become "lost". It is actually sometimes quite difficult to relate
the land you see around you to what is shown on the map if there are no clearly
distinguishing features. If however you have plotted your course first and
then referred regularly to the map during the walk, you will always have a
pretty good idea where you are eg. the footpath going over a marked
footbridge, passing through a wall, past a barn or a farm etc. Do
not be lulled into a false sense of security by thinking because you have
seen a clearly marked signpost (eg. 3 miles to village x) or a bright yellow
blob on a farm wall that there will necessarily be another equivalent marker
when the path becomes indistinct on the fell or even changes to another
landowner's property. In the UK, we seem to have a
bad habit of only doing half a job on footpath marking! This
can also be a time when use of the compass comes into its own. However to be
effective in route finding, you need to know where you are when you use it.
Although it is theoretically possible to establish your location by using
the compass, this assumes that you can clearly identify some landmarks. This
is not always so straightforward.
Using
a Map and Compass Reading List
All information on this
site is given in good faith and no liability is accepted in respect of any
damage, loss or injury which might result from acting on it.
|

.jpg)
.jpg)
.jpg)